프로젝트를 하던 도중 세부적인 CPU 사용량과 context switching에 소모되는 리소스를 관측해야 하는 일이 생겨 이를 도와줄 수 있는 툴에 대해 찾아보게 되었다.
vmstat
메모리, 시스템 프로세스, 페이징, 인터럽트, I/O, CPU 스케줄링에 대한 정보를 수집해 전체 호스트 수준에서 보여주는 툴이다.
|
1
2
3
|
Bprocs -----------memory---------- ---swap-- -----io---- -system-- ------cpu-----
r b swpd free buff cache si so bi bo in cs us sy id wa st
0 0 4608 1216236 76632 12827516 0 0 0 5 1 1 0 0 99 0 0
|
cs |
위와 같은 정보를 확인할 수 있으며, 이 중 in(interrupt), cs(Context Switching)이 Context Switching 비용과 관련 있다. CPU 사용량 단위는 ‘%’이고 메모리 사용 단위는 ‘KB’이다.
Vmstat가 제공한는 각 지표의 의미는 다음과 같다
- process
- r: 실행 가능한 프로세스
- b: 블로킹된 프로세스
- memory
- swpd: 스왑 메모리
- free: 미사용 메모리
- buff: 버퍼로 사용한 메모리
- cache: 캐로 사용한 메모리
- swap
- si: 디스크로 교체된 들어간 메모리(swap-in)
- so: 디스크에서 교체되 빠져나온 메모리(swap-out)
- io
- bi(block-in): input 장치에서 받은 512 바이트 블록 개수
- bo(block-out): output 장치로 보낸 512 바이트 블록 개수
- system
- in: interrupt 횟수
- cs: context switching 횟수
- cpu(단위: %)
- us: 유저 시간
- sy: 커널 시간(system time)
- id: 유휴 시간
- wa: 대기 시간
- st: 도둑 맞은 시간(가상 머신에 할애된 시간)
특정 기간을 두고 특정 횟수만큼 측정을 하고 싶다면 다음과 같이 vmstat를 사용하면 된다.
|
1
|
vmstat 5 10 # 5초의 간격을 두고 10번 캡쳐한다
|
cs |
1초에 한번 관측되는 수치 변화를 계속 보고 싶다면 다음과 같이 사용하면 된다.
|
주의해야 할
|
|
지표
만약 위 지표 중 cpu의 us(유저 모드에서 CPU 사용률)가 100% 근처에 도달하지 못했는데 어떤 프로세스에서 콘텍스트 스위칭 비율(system 지표에서 cs)이 높게 나왔다면, 이는 I/O에서 블로킹이 발생했서나 스레드 락 경합(thread lock contention) 상황이 발생했을 확률이 크다.
cperf
복합적인 시스템 퍼포먼스 통계를 내주는 툴이다.
설치:
|
1
2
|
sudo apt-get install linux-tools-common linux-tools-generic
sudo apt install linux-tools-5.15.0-52-generic linux-cloud-tools-5.15.0-52-generic
|
cs |
다음과 같이 임의의 시간 동안 데이터를 수집해 통계를 낼 수 있다
|
1
|
sudo perf stat -a sleep 20 # 20초 동안 데이터를 수집한다
|
cs |
통계 결과:
|
1
2
3
4
5
6
7
8
9
10
11
12
13
14
15
|
Performance counter stats for 'system wide':
80,007.09 msec cpu-clock # 4.000 CPUs utilized
9,832 context-switches # 122.889 /sec
202 cpu-migrations # 2.525 /sec
2,393 page-faults # 29.910 /sec
3,338,969,186 cycles # 0.042 GHz (83.32%)
3,830,939,977 stalled-cycles-frontend # 114.73% frontend cycles idle (83.32%)
3,454,468,148 stalled-cycles-backend # 103.46% backend cycles idle (66.69%)
482,245,519 instructions # 0.14 insn per cycle
# 7.94 stalled cycles per insn (83.34%)
98,889,967 branches # 1.236 M/sec (83.34%)
14,826,643 branch-misses # 14.99% of all branches (83.33%)
20.001630108 seconds time elapsed
|
cs |
특정 프로세스의 동작을 특정 시간동안 확인하고 싶다면, 다음과 같은 명령어를 사용하면 된다
|
1
|
sudo perf record -F 99 -p PID sleep 10
|
cs |
이렇게 수집된 특정 프로세스의 데이터는 .data 확장자를 가진 바이너리 파일로 저장된다. 이 파일 수치를 확인하기 위해선 다음과 같은 명령어를 사용하면 된다.
|
1
|
sudo perf report
|
cs |
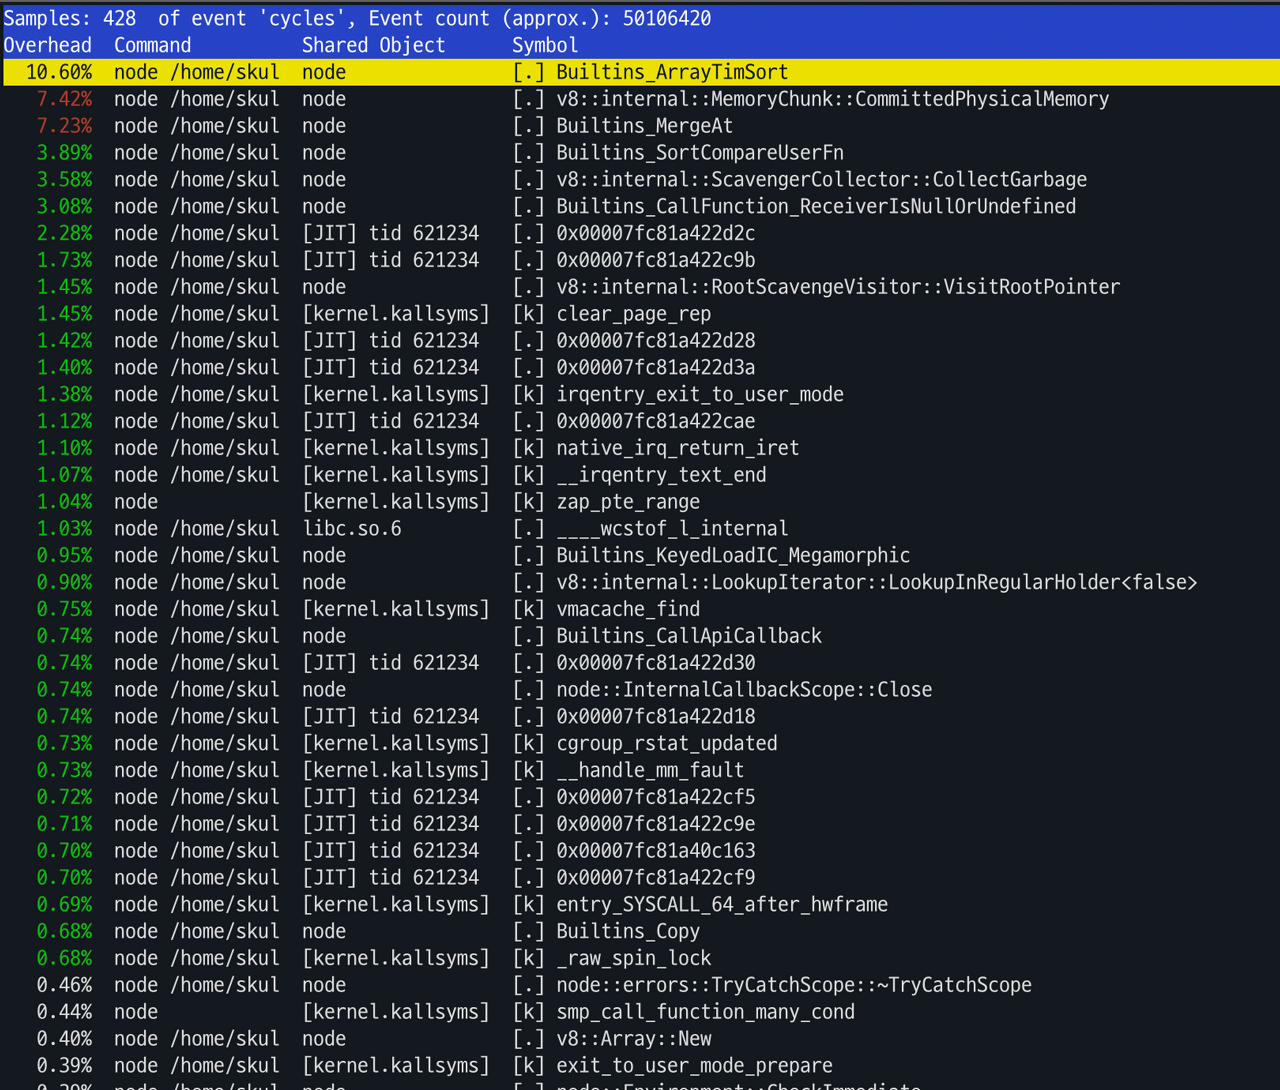
Context Switching 테스트
위에서 소개한 툴들의 정상 동작 여부를 확인하기 위해 일부러 콘텍스트 스위칭을 많이 발생시키는 코드를 만들고 돌려보자.
time.csv:
|
1
2
3
4
5
6
7
8
9
|
past_date,future_date
2006-12-28,2030-03-23
2001-11-20,2026-10-30
2006-12-28,2035-03-23
2004-11-20,2024-01-30
2003-12-28,2035-03-23
2002-11-20,2024-08-30
2005-12-28,2033-03-23
2005-07-20,2051-01-30
|
cs |
contextSwitch.go:
|
1
2
3
4
5
6
7
8
9
10
11
12
13
14
15
16
17
18
19
20
21
22
23
24
25
26
27
28
29
30
31
32
33
34
35
36
37
38
39
40
41
42
43
44
45
46
47
48
49
50
51
52
53
54
|
gpackage main
import (
"encoding/csv"
"fmt"
"log"
"os"
"sync"
"time"
)
func f(from string) {
var wg sync.WaitGroup
sliceLength := 1000000
wg.Add(sliceLength)
for i := 0; i < sliceLength; i++ {
records := readCsvFile("time.csv")
go func(i int) {
defer wg.Done()
for _, record := range records {
layout := "2006-01-02"
past_date, _ := time.Parse(layout, record[0])
future_date, _ := time.Parse(layout, record[1])
past_date.Date()
future_date.Date()
}
}(i)
}
wg.Wait()
}
func readCsvFile(filePath string) [][]string {
f, err := os.Open(filePath)
if err != nil {
log.Fatal("Unable to read input file "+filePath, err)
}
defer f.Close()
csvReader := csv.NewReader(f)
records, err := csvReader.ReadAll()
if err != nil {
log.Fatal("Unable to parse file as CSV for "+filePath, err)
}
return records
}
func main() {
f("direct")
fmt.Println("done")
}
|
cs |
이제 위 코드를 구동시켜보자
|
1
|
go run contextSwitch.go
|
cs |
이제 vmstat와 pref를 이용해 위 코드가 구동되는 사이의 수치를 관측하면 된다.
vmstat 결과 (사용 명령어: vmstat 1)
콘텍스트 스위칭 발생 시 system에 속하는 in(interrupt)와 cs(context switching) 수치가 월등히 높아진 것을 확인할 수 있다.
contextSwitch.go를 실행한 상태:
|
1
2
3
4
5
6
7
8
9
10
11
|
procs -----------memory---------- ---swap-- -----io---- -system-- ------cpu-----
r b swpd free buff cache si so bi bo in cs us sy id wa st
4 0 4608 1189036 93012 12857336 0 0 0 5 1 1 0 0 99 0 0
4 0 4608 1188004 93012 12857336 0 0 0 0 12955 127689 38 13 49 0 0
4 0 4608 1187104 93012 12857336 0 0 0 0 13228 125807 35 16 48 0 0
2 0 4608 1185200 93012 12857336 0 0 0 0 13595 123887 37 14 49 0 0
3 0 4608 1184500 93012 12857336 0 0 0 0 13349 126304 35 14 50 0 0
4 0 4608 1184500 93020 12857328 0 0 0 92 13183 128388 34 16 49 0 0
2 0 4608 1182736 93020 12857336 0 0 0 0 13236 126502 35 16 49 0 0
1 0 4608 1182876 93020 12857336 0 0 0 0 13284 125777 35 16 48 0 0
4 0 4608 1181980 93020 12857336 0 0 0 0 14028 121666 35 15 50 0 0
|
cs |
일반 상황:
|
1
2
3
4
5
6
7
8
9
10
11
12
13
14
|
procs -----------memory---------- ---swap-- -----io---- -system-- ------cpu-----
r b swpd free buff cache si so bi bo in cs us sy id wa st
0 0 4608 1175292 93216 12856044 0 0 0 5 1 1 0 0 99 0 0
0 0 4608 1175180 93216 12856044 0 0 0 0 295 477 0 0 100 0 0
0 0 4608 1174704 93224 12856044 0 0 0 44 284 491 0 0 99 0 0
0 0 4608 1175208 93224 12856044 0 0 0 0 277 486 1 0 99 0 0
0 0 4608 1174956 93224 12856044 0 0 0 0 258 472 0 0 100 0 0
1 0 4608 1174792 93224 12856044 0 0 0 0 299 516 1 0 99 0 0
0 0 4608 1174452 93224 12856044 0 0 0 0 284 484 1 1 99 0 0
0 0 4608 1174928 93224 12856044 0 0 0 0 259 458 0 0 100 0 0
0 0 4608 1174452 93224 12856044 0 0 0 84 300 497 1 0 99 0 0
0 0 4608 1174956 93224 12856044 0 0 0 0 290 488 0 0 100 0 0
0 0 4608 1174452 93224 12856044 0 0 0 0 297 510 1 0 99 0 0
0 0 4608 1175208 93224 12856044 0 0 0 0 290 520 1 0 99 0 0
|
cs |
perf 결과 (사용 명령어: sudo perf stat -a sleep 20)
contextSwitch.go를 실행한 상태:
|
1
2
3
4
5
6
7
8
9
10
11
12
13
14
15
|
Performance counter stats for 'system wide':
80,011.25 msec cpu-clock # 4.000 CPUs utilized
2,279,586 context-switches # 28.491 K/sec
13,291 cpu-migrations # 166.114 /sec
123,884 page-faults # 1.548 K/sec
114,869,775,771 cycles # 1.436 GHz (83.32%)
122,889,824,804 stalled-cycles-frontend # 106.98% frontend cycles idle (83.32%)
103,631,665,515 stalled-cycles-backend # 90.22% backend cycles idle (66.68%)
92,521,223,777 instructions # 0.81 insn per cycle
# 1.33 stalled cycles per insn (83.34%)
19,027,317,534 branches # 237.808 M/sec (83.34%)
170,918,900 branch-misses # 0.90% of all branches (83.33%)
20.002279774 seconds time elapsed
|
cs |
일반 상황:
|
1
2
3
4
5
6
7
8
9
10
11
12
13
14
15
|
Performance counter stats for 'system wide':
80,007.03 msec cpu-clock # 4.000 CPUs utilized
9,509 context-switches # 118.852 /sec
202 cpu-migrations # 2.525 /sec
2,329 page-faults # 29.110 /sec
3,287,813,081 cycles # 0.041 GHz (83.32%)
3,728,859,681 stalled-cycles-frontend # 113.41% frontend cycles idle (83.32%)
3,400,931,749 stalled-cycles-backend # 103.44% backend cycles idle (66.69%)
472,904,185 instructions # 0.14 insn per cycle
# 7.89 stalled cycles per insn (83.34%)
96,356,371 branches # 1.204 M/sec (83.34%)
14,636,573 branch-misses # 15.19% of all branches (83.34%)
20.001863836 seconds time elapsed
|
cs |
참고 자료:
High context switch and interrupt rates: How to diagnose and fix in linux